The Noise Weighting Scales Adjust
raw recorded measurements in a way so that various concerns, like health effects, broadcast quality, or physical damage, can be correlated to a single adjusted value across a range of frequencies. Frequency weightings are used to normalize sound pressure measurements. Because greater sound pressure levels at very low frequencies, say 10 Hz, are perceived as being less loud than the same sound pressure levels at 1000 Hz, lower frequency sound pressure values are generally reduced, whereas, sound pressure values between about 700 Hz and 7000 Hz are adjusted very little. In general and for frequencies less than about 4000 Hz, sound pressure levels at low frequencies are perceived as being not as loud as sound pressure levels at higher frequencies. Above about 4000 Hz, other cumulative effects have been noted. Thus, higher sound pressure levels, below about 4000 Hz, are tolerated better at lower frequencies than at higher frequencies.
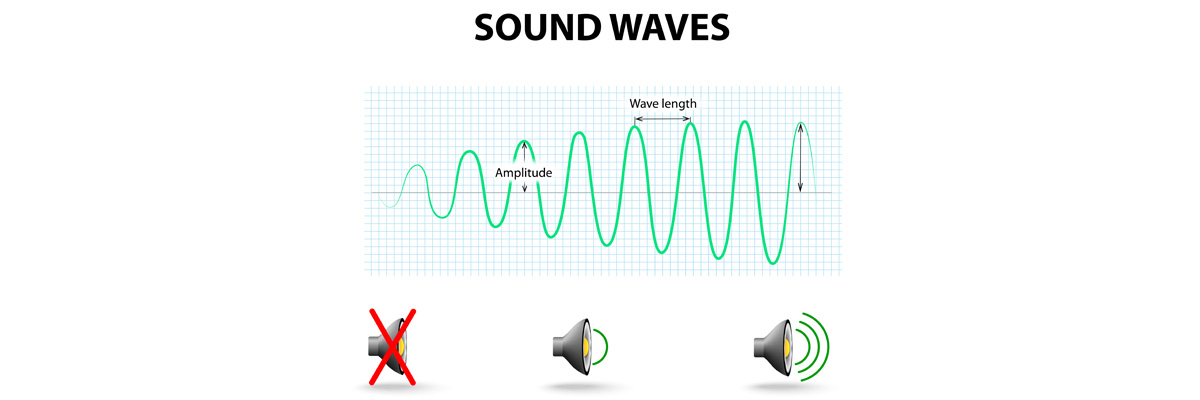
While one could create a chart of sound pressure levels verses frequency for various concerns, industry and others have chosen to adjust sound pressure levels by adding or subtracting fixed values from measured raw sound pressure levels; in other words; weight the measured sound pressure values to create noise weighting scales.
Noise Weighting Scales From OSHA Technical Manual
A‐weighting:
A measurement scale that approximates the “loudness” of tones relative to a 40‐dB sound pressure level, 1,000‐Hz reference tone. A‐weighting is said to best fit the frequency response of the human ear: when a sound dosimeter is set to A‐weighting, it responds to the frequency components of sound much like your ear responds. A‐weighting has the added advantage of being correlated with annoyance measures and is most responsive to the mid‐frequencies, 500 Hz to 4,000 Hz.
B‐weighting:
B‐weighting is similar to A‐weighting but with less attenuation. B‐weighting was an attempt to approximate human perception of loudness for moderately high sound pressure levels. It is now outdated and no longer used.
C‐weighting:
A measurement scale that approximates the “loudness” of tones relative to a 90‐dB sound pressure level, 1,000‐Hz reference tone. C‐weighting has the added advantage of providing a relatively “flat” measurement scale that includes very low frequencies.Linear weighting: A weighting most commonly found on upper model sound level meters, typically used when performing octave band filtering analysis.
Z‐weighting:
An unweighted measurement scale that does not apply any attenuation or weighting to any frequency. Instead, this scale provides a flat response across the entire spectrum from 10 Hz to 20,000 Hz, making it useful for octave band analysis and evaluating engineering controls.
The Department of Defense ( DOD ) discusses C-weighting
or dBC, which is “the standard abbreviation for sound levels measured with an instrument set to the C-weighting network. The C-weighting network corresponds to the ear’s response for levels above 85 dB, which is different than other noise weighting scales. When exposures to steady-state noise below 130 dBA occur simultaneously within the same 24-hour period as exposure to impulse noise above 130 dB C-weighted peak, apply the hazard criteria separately (i.e., the allowable exposure to steady-state noise (e.g., engine noise) shall not be reduced because of exposure to impulse noise (e.g., weapon firing)).”
Coast Guard’s recommended guidelines to the U.S with noise weighting scales.
maritime industry for addressing conditions of high noise. The Coast Guard says “Noise measurements should be taken in decibels using an A weighting filter (dB(A)). The meter should be set to “slow” response and the readings made only to the nearest decibel. A measuring time of at least 5 seconds should be allowed. If a meter fluctuates in level within a range of 5 dB maximum to minimum, an estimate of the level may be made by averaging the excursions of the needle with the eye. It is suggested that C-weighted levels also be taken. Furthermore, to facilitate analysis of noise in certain areas where engineering controls may be applied, measurement of noise by octave band levels should be considered. A form found convenient for recording the noise data is attached. A wind screen on the microphone should be used in locations where air motion is noticeable, such as bridge wings, lookout positions, and near fans and ventilators.
U. S. EPA’s NOISE EFFECTS HANDBOOK asks
What is the best weighting system to use for analysis of individual subjective, psychological response?
The handbook responds with “In most cases, the A-weighting scheme can be used to study individual response to noise. Figure 7-1 shows how the A-weighting network on a sound level meter discriminates sounds at different frequencies compared to the B and C-weightings. A recent study has indicated that the D and E weightings (compared to other noise weighting scales) generally perform somewhat better than A-weighting. Computational schemes, such as Stevens’ Mark VI and Mark VII loudness calculation procedures, Zwicker’s loudness calculation procedure, Perceived Noise Level, etc., are typically superior to the frequency weightings. In the long run, however, none of these other weightings or calculation schemes need to displace the simple A-weighting which has the added advantages of ease of use, public acceptance, and reasonable accuracy. (73)

Noise Weighting Scales from U. S. EPA’s NOISE EFFECTS HANDBOOK
Do you have more questions about noise weighting scales?
Use this form to contact us
Visit CasellaSolutions.com

